

Don’t ask for a “Map.” By convention, a map showing coastlines, water depths, and other information of use to navigators is always called a chart. Calling it a map is like calling the bow the pointy end.
Chart Reading 101
By Don Casey / BoatUS
[dropcap]E[/dropcap]xcept aboard the shallowest of craft, venturing beyond narrow or familiar waters means you need a chart. If you are not acquainted with charts, they can look intimidating, but their mystery cannot survive 10 minutes of study. To learn about charts, buy one for the waters you want to navigate. The chart seller can tell you which one you need.
Scale
When you are buying a chart of specific waters, you typically have a choice between a chart that covers a smaller area in greater detail or one that covers a larger area in less detail. The scale of a harbor chart, for example, might be 1:20,000, meaning that 1″ on the chart represents 20,000″ of the earth’s surface or about 0.27 nautical miles. That makes a mile on the water a little less than 4″ on the chart. Harbor charts will be very detailed.
Small-craft charts come folded like a road map for more convenient use on smaller boats. The scale of small-craft charts is often 1:40,000, so a nautical mile is about 1.8″ on this scale chart.
The scale designation on charts is a fraction (1/40,000), so the larger the number after the colon (or slash), the larger the area the chart shows, but the smaller the scale. So-called coastal charts, for example, typically use a 1:80,000 scale. That makes a nautical mile less than an inch and lets a single chart cover a 30 mile by 40-mile area, but with less detail than a large-scale chart. General charts with scales as small as 1:1,200,000 cover huge areas–600 miles or more–but with little detail. Such small scale charts are useful primarily for route planning.
Depths
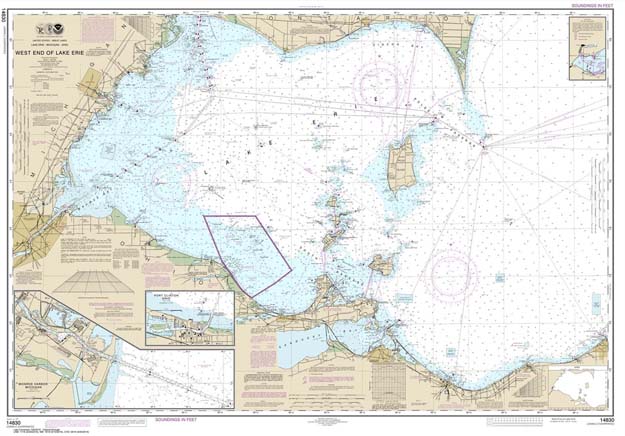
Navigation chart for Lake Erie. USNautical Marine chart.
Numbers printed on the water areas of the chart indicate the depth of the water at that spot. However, a 2 on the chart might mean two feet, two fathoms, or two meters. It is essential to know which unit of measurement is used. This is always shown on the face of the chart in large print–SOUNDINGS IN FATHOMS AND FEET, for example. A fathom, by the way, is six feet, so on a chart with soundings in fathoms, a number such as 03 means zero fathoms and three feet. The water at this spot is three feet deep at MLLW. A sounding of 55 would be 35 feet (five fathoms and five feet). In 1992 U.S. charts began switching from feet and fathoms to soundings in meters. If your brain hasn’t made that switch, you can divide soundings in meters by 0.3 to get the approximate depth in feet.
The soundings printed on the chart normally represent the depth at mean lower low water (MLLW), so the actual depth is usually more than the charted depth. However, when the tide table shows a negative low-tide entry, actual depths will be less than the chart indicates. When the depth of the water is a concern, you will need to know the height of the tide.
Contour lines
In addition to numerical depths, charts show depth contour lines. The 10-fathom contour line on a small scale chart, for example, indicates that all the waters inside this line are no more than 60 feet deep. On larger scale charts, contour lines are often shown for three fathoms, two fathoms, one fathom, and sometimes even three feet. Typically, the area inside either the three fathoms or one-fathom contour line is tinted blue to provide quick identification of shoal water.
Symbols And Abbreviations
In addition to water depths–including the shoreline-, charts show the location of rocks, reefs, wrecks and other submerged obstructions, anchorages, channels, lighthouses, buoys, and even tide rips. The symbols and abbreviations for these features are often obvious but sometimes less so. All are illustrated and explained in NOS Chart No. 1: Symbols, Abbreviations and Terms, which isn’t a chart at all, but a booklet. It used to cost about two bucks from the government, but today a hard copy, available only from a commercial vendor, will set you back about $10. Or you can download an electronic copy to your computer for free from NOAA. Either way, reading through Chart No. 1 will reveal new and useful details that charts often include.
Aids To Navigation
Red day beacons are shown on your chart as small triangles. The green ones–any color but red, actually–appear as small squares. Lighted markers have a magenta flare symbol–like an exclamation mark. A variety of symbols are used for buoys. Lighthouses are generally shown as a dot inside a magenta disk, sometimes with the flare symbol. All are illustrated in Chart No. 1.
Prominent land features, such as towers, buildings, and even hills may also be shown on the chart if they might be valuable to the navigator. Many older charts also include Loran-C time distance lines.
Compass Rose
At various locations on the chart you will find groups of three concentric circles of ruler-like hatch marks. This is called a compass rose, and it indicates true north–the outer circle–and magnetic north–the inner circles. Since you are almost certain to be steering by magnetic compass, you will nearly always use the inner circles, normally the one marked in degrees from 0 to 360.
Plotting Course And Distance
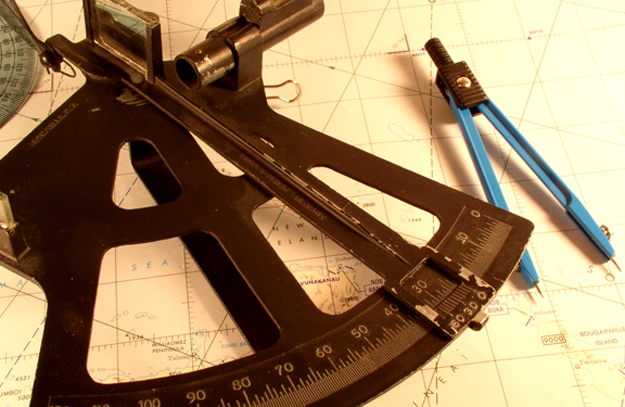
The list of essential plotting tools is short. . . . Read more
NOTE: Featured Image is from Chart Reading 101 by Don Casey’s BoatTECH. BoatUS image.
About
Don Casey has been one of the most consulted experts on boat care and upgrades for 30 years and is one of the BoatUS Magazine’s panels of experts. He and his wife cruise aboard their 30-footer part of the year in the eastern Caribbean. His books include Don Casey’s Complete Illustrated Sailboat Maintenance Manual, and the recently updated This Old Boat, the bible for do-it-yourself boaters.